Viewing usage data
Usage report views provide historical data visualization for your account so that you can track account resource usage. You can display data for different resources and filter the report to show data for regions, departments, groups, and users. You can also export a CSV Comma-Separated Values – A text file that uses the comma (,) character to delimit between values. CSV files can import directly into a worksheet application, such as Microsoft Excel. report to view in a worksheet application, such as Microsoft Excel.
Contents
Viewing usage data
Notes
- Most reports display data only up to the previous day. Only the Right Now report displays data from the current day.
- The graph displays only account and region data. The table below the graph displays additional groupings, such as user and department.
- Line-item (ungrouped) reports are available from the Report type menu.
- In addition to manually generated usage reports, you can stream usage data using the Kyndryl Cloud Uplift webhook service. For more information, see Configuring the Kyndryl Cloud Uplift webhook service for usage data.
To view usage data
-
From the navigation bar, click Manage > Reporting.
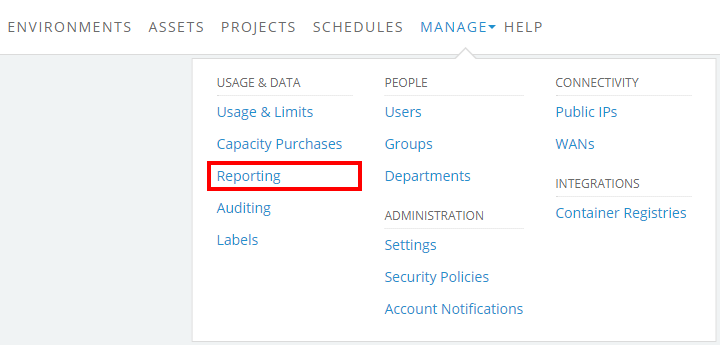
The Reporting page displays.
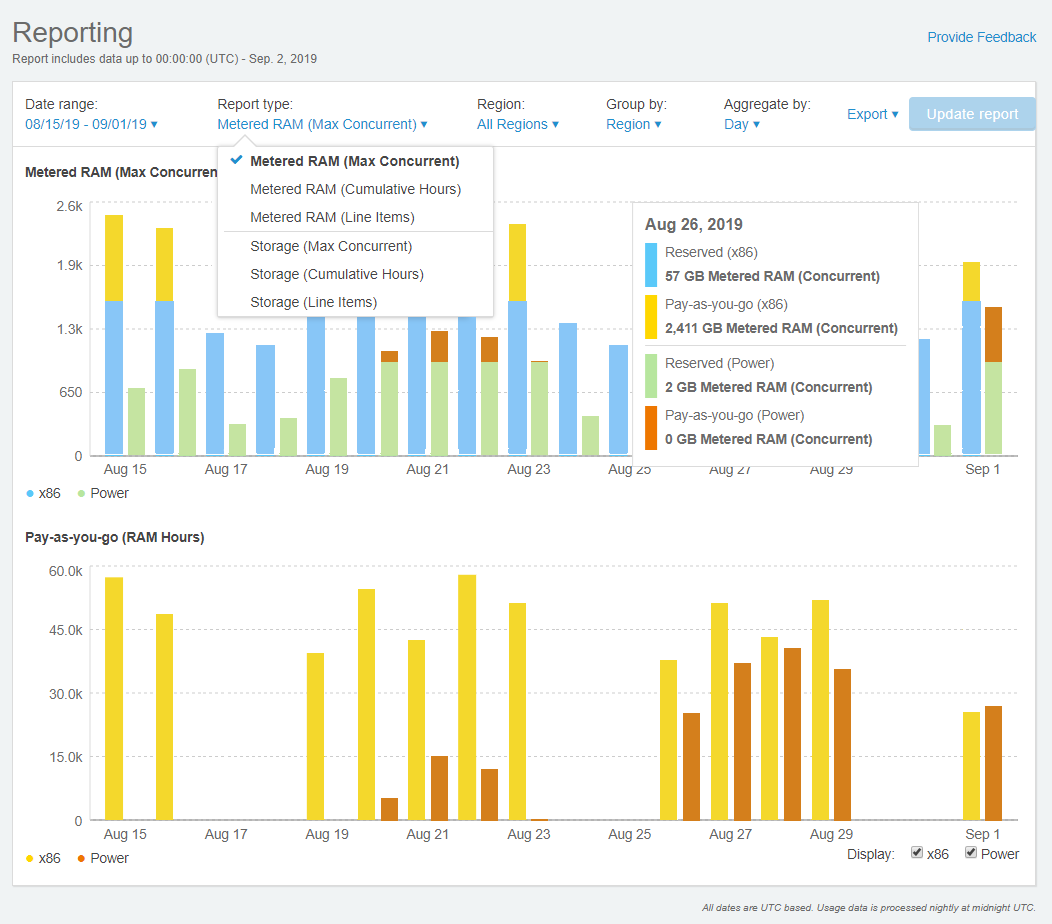
Hover over an individual aggregate period to see usage details.
Depending on your account type, if your account usage exceeds your account limit during the selected Date range, an additional Bursting graph displays below the main report graph. The Bursting graph displays only the usage in excess of the account limit for the selected report type.
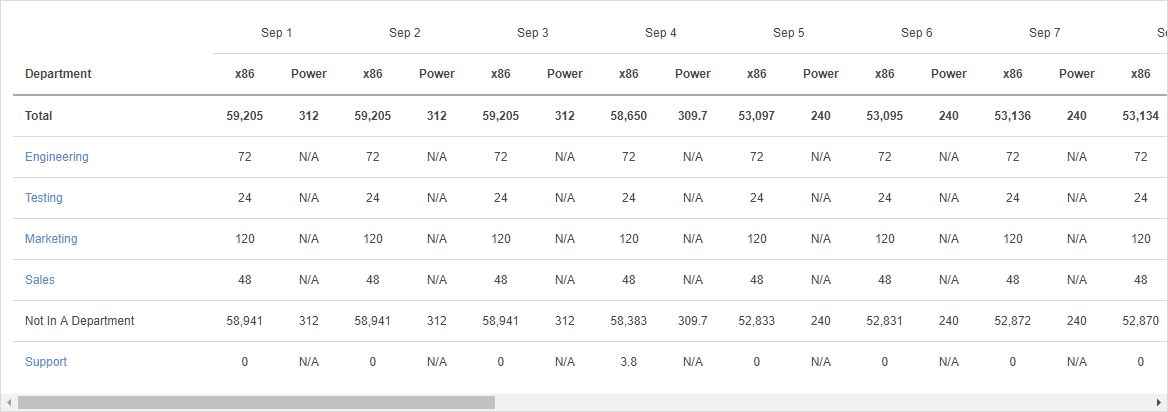
Additional report data is displayed in a table to provide additional details. You choose the table rows when you choose the Group by value, and the columns when you choose the Aggregate by value.
-
Select parameters for the report:

Date range – Choose the period of time for which you want to see data:
- Right now – Displays current usage.
- Yesterday – Displays data from the previous 24-hour billing day.
- Current week – Displays data from the current calendar week.
- Last week – Displays data from the previous calendar week.
- Last 30 days – Displays data from the previous 30 days.
- Current month – Displays data from the current calendar month.
- Last month – Displays data from the previous calendar month.
- Last 90 days – Displays data from the previous 90 days.
- Custom – Displays data from a date range that you specify.
Report type – Choose which resource to display:
- Metered RAM (Max Concurrent) – Displays the maximum amount of Metered RAM A unit of measurement used to calculate VM usage, based on the amount of RAM (in GB) for a VM. To learn more, see How usage is calculated. used concurrently at any point during the aggregate period.
- Metered RAM (Cumulative Hours) – Displays the total number of Metered RAM hours A unit of measurement that corresponds to the total number of hours that your account has run VMs, translated into their Metered RAM equivalents. 1 Metered RAM hour is equivalent to 1 GB of Metered RAM running for 1 hour. To learn more, see How usage is calculated. used during the aggregate period.
- Metered RAM (Line Items) – Displays the individual line items of raw usage data, allowing you to see every instance of Metered RAM usage.
- Multi-Attach Storage (Max Concurrent) – Displays the maximum amount of Multi-Attach Storage The amount of data storage space used by Multi-Attach storage disk sets in environments and templates. used at any point during the aggregate period.
- Multi-Attach Storage (Cumulative Hours) – Displays the total number of Multi-Attach Storage hours The amount of data storage space used by by Multi-Attach storage disk sets in environments and templates on an hourly basis. used during the aggregate period.
- Multi-Attach Storage (Line Items) – Displays the individual line items of raw usage data, allowing you to see every instance of Multi-Attach Storage usage.
- Storage (Max Concurrent) – Displays the maximum amount of storage The amount of data storage space used by assets, environments, and templates. used at any point during the aggregate period.
- Storage (Cumulative Hours) – Displays the total number of storage hours The amount of data storage space used by assets, environments, and templates, on an hourly basis. used during the aggregate period.
- Storage (Line Items) – Displays the individual line items of raw usage data, allowing you to see every instance of storage usage.
Region – Choose which region or regions to include.
Group by – Choose how you want to organize the report:
- User – Displays usage by resource owner.
- Region – Displays usage by region A data center located in a unique geographic area. When you upload an asset or import a VM, you must specify its region. To learn more, see Understanding regions. .
- Department – Displays usage by department A group of users who share usage limits for RAM hours, concurrent Metered RAM, and Storage. To learn more, see Managing departments. , as well as the usage of each resource owner within those departments.
- Group – Displays usage by groupsgroup: A set of related users. Groups can share resources through projects. To learn more, see Managing groups., as well as the usage of each resource owner within each group.
The usage for a resource owner is attributed to any groups that they belong to at the time the report is generated.
Aggregate by – Choose an aggregate time period:
- Day – Displays data grouped into calendar day increments.
- Week – Displays data grouped into calendar week increments.
- Month – Displays data grouped into calendar month increments.
Ungrouped reports can’t be aggregated.
-
Click
 (Update Report) to view the information in your browser.
If you need a faster report, change the parameters to create a smaller report (for example, choose a shorter time period or aggregate by month instead of by day).
Exporting a usage data report
You can export CSV reports of usage data for deeper analysis in a worksheet application, such as Microsoft Excel.
Notes
- Labels are visible only in downloaded CSV (Line Item) reports. For more information, see Using labels for in-depth usage reporting.
- Most CSV reports can display data up to and including the previous day of usage. The Right Now report is the only report that includes usage data from the current usage day.
To export a usage report
-
From the navigation bar, click Manage > Reporting.

-
Select parameters for the report:
-
Click
 (Export options) to choose a CSV report.
- To export a CSV report of x86 VMs, click
 Export CSV.
 - To Export a CSV report of Power VMs, click
 Export CSV (Power).
Most reports are generated in a few seconds. Large reports can take longer. A busy pointer displays when a large report is being generated. If you need the full report but don’t want to wait for it to compile, click Email CSV. The report is generated offline, and then a link to the report is emailed to the address associated with your user account.
- To export a CSV report of x86 VMs, click